
A logframe turns a good idea into a plan a funder can trust: what you will do, what will change, how you will know, and what has to go right. Here is how to write one that holds together, with a worked example and a free tool that builds it for you.
If you have applied for funding from a selected donor, a development agency, a foundation or a government programme, you have almost certainly been asked for a logframe. For many teams it is the most dreaded page of the proposal: a grid of boxes that seems to demand certainty about things nobody can predict.
It does not have to feel that way. A well-written logframe is simply your project’s logic on one page. It forces the questions that matter early, while they are still cheap to answer, and it becomes the backbone of your monitoring, reporting and evaluation. This guide shows you how to write one, step by step.
What is a logframe?
A logframe, short for logical framework, is a matrix that summarises a project in four levels of results and four columns of evidence. Reading down, it shows the chain from what you do to the long-term change you contribute to. Reading across, it shows how each result will be measured, where the data will come from, and which conditions outside your control must hold.
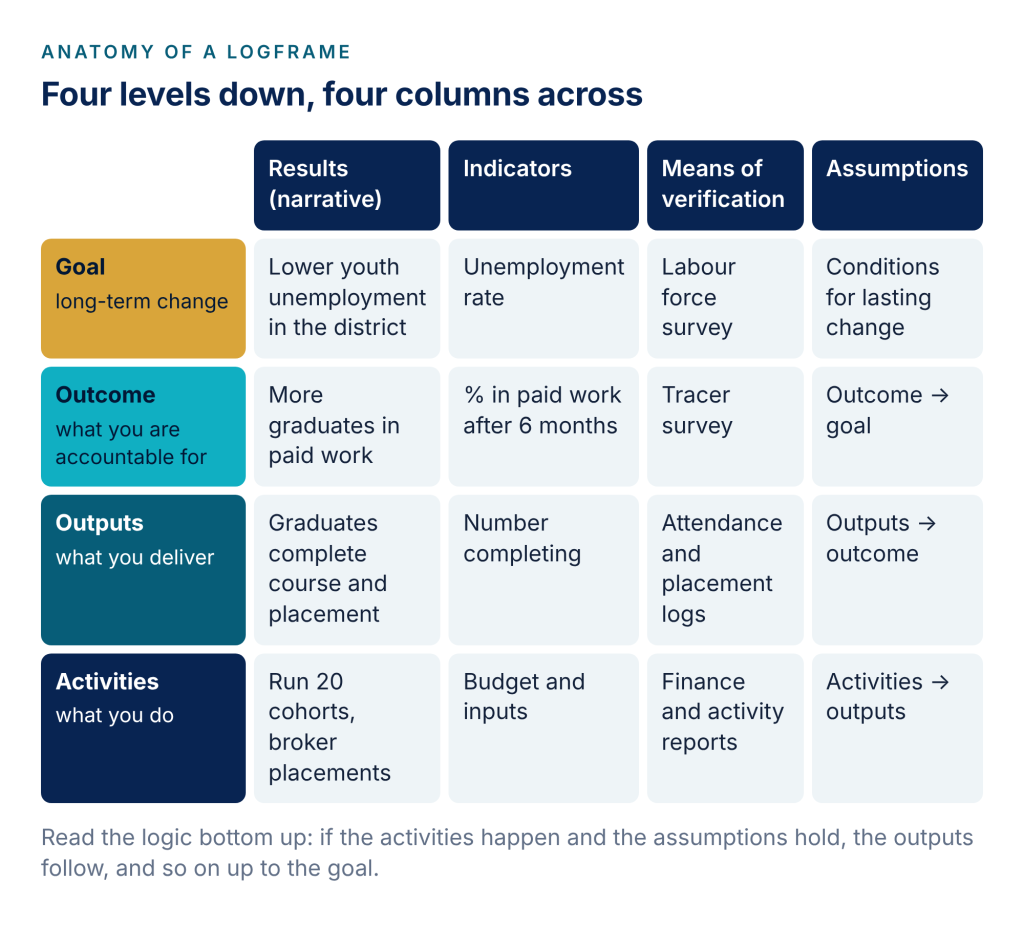
The four levels go by different names depending on the funder, so it helps to know the common equivalents:
| Level | Common alternatives | What it describes |
|---|---|---|
| Goal | Impact, overall objective | The long-term change your project contributes to, alongside others |
| Outcome | Purpose, specific objective | The change you are accountable for by the end of the project |
| Outputs | Results, deliverables | The products and services you deliver and control |
| Activities | Tasks, inputs | What the team does, and the resources it uses |
Theory of change vs logframe: what is the difference?
This is one of the most common questions in monitoring and evaluation, and the short answer is that they do different jobs. A theory of change explains why you expect change to happen. It maps the pathways, preconditions and evidence, including what other actors contribute. A logframe manages delivery. It takes the pathway your project will own and sets it out as a tidy plan you can monitor and report against.
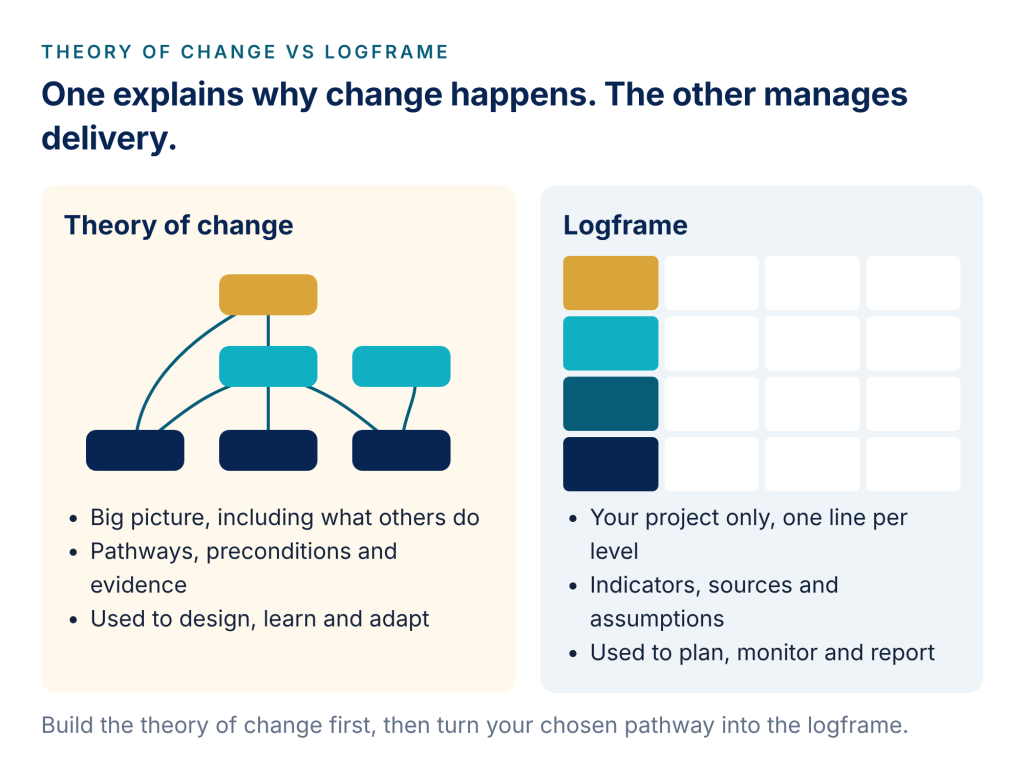
The University of Edinburgh’s introduction to theory of change puts it well: the logframe emphasises accountability, while the theory of change emerged as a reaction to that linearity. Evaluators also warn that a theory of change drawn with arrows that all point one way is often “just a logframe in disguise”. The practical answer is to do both, in order: build your theory of change first, then write the logframe from it.
How to write a logframe in seven steps
We will use one worked example throughout: Skills for Work, an invented two-year programme that trains young people aged 18 to 29 in digital skills and places them with employers.
1. Start from your theory of change
Do not open a blank grid. Take the pathway from your theory of change that your project will deliver, and the problem statement behind it. Every row of the logframe should trace back to a box on that map. If something in the logframe has no home in the theory of change, either the map is incomplete or the activity does not belong.
2. Write the goal and the outcome
The goal is the wider change you contribute to: “Lower youth unemployment in the district.” You will not achieve it alone, and your funder knows that. The outcome is the change you will be held to: “More young graduates of the programme are in paid work.” Keep to one outcome if you can, and never more than three. Write results as changed states, not as actions: “more graduates in paid work”, not “to increase employment”.
3. List the outputs you control
Outputs are what you deliver: “400 graduates complete the course and a work placement.” The test is control. If your team can guarantee it with enough effort and budget, it is an output. If it depends on other people choosing to change, it is an outcome.
4. Add the activities
Under each output, list the main activities that produce it: run 20 cohorts, recruit and train trainers, broker 60 employer placements. Keep this level short; your workplan holds the detail. Many donors put inputs and budget in the indicator column at this level instead of indicators.
5. Choose indicators, baselines and targets
For each result, choose one to three indicators that would convince a sceptical reader the result happened. Give each one a baseline (where you start) and a target (where you aim to be, by when). Our companion guide, SMART indicators: examples for every level, covers how to word them so they can actually be measured.
6. Name the means of verification
For every indicator, say where the evidence will come from, how it will be collected, how often, and how it will be broken down. “Tracer survey of graduates by phone, every six months, by sex and county” is a means of verification. “Survey” is not. If you cannot name a source you can afford, change the indicator.
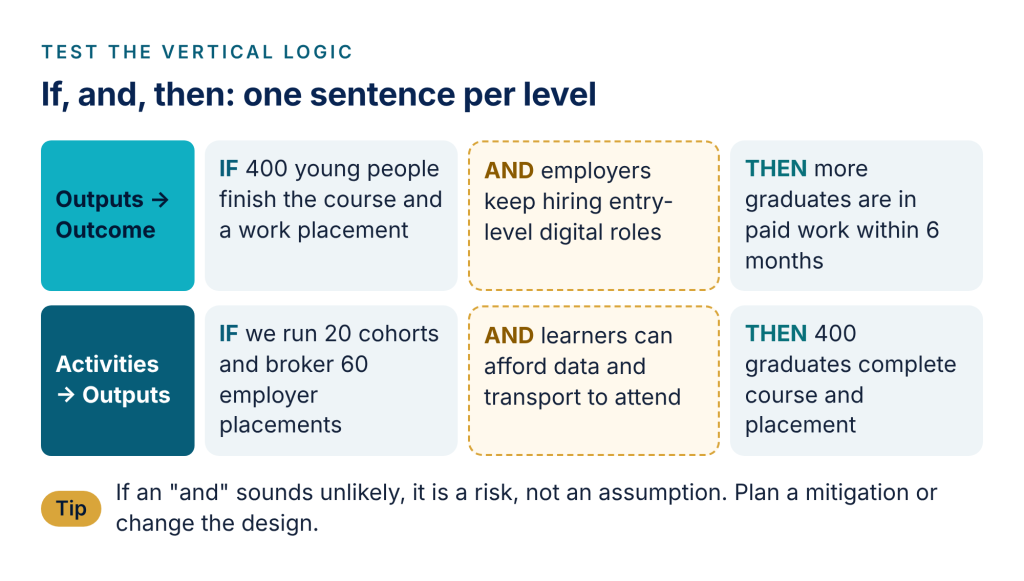
7. Write the assumptions and test the logic
Assumptions are the conditions outside your control that must hold for one level to lead to the next. Write them on the level where they apply, then read your logframe from the bottom up as a series of sentences. tools4dev describes the same test: if these activities are undertaken and the assumptions are true, then these outputs will be produced.
Assumption or risk?
An assumption is a condition you expect to hold. A risk is something that could go wrong and that you plan for. If an assumption feels shaky, move it to your risk register, rate its likelihood and impact, and write the mitigation. That is a stronger proposal than an optimistic assumption.
A worked logframe example
Here is the Skills for Work logframe in full. Use it as a model for the level of detail most funders expect.
| Level | Result | Indicator (baseline to target) | Means of verification | Assumptions |
|---|---|---|---|---|
| Goal | Lower youth unemployment in the district | Youth unemployment rate (27% → contribution only, no target) | National labour force survey, yearly | Economy does not enter recession |
| Outcome | More programme graduates are in paid work | % of graduates in paid work 6 months after completion (22% – 55% by Dec 2027) | Tracer survey by phone, every 6 months, by sex and county | Employers keep hiring entry-level digital roles |
| Output 1 | Graduates complete the course and a placement | Number completing both (0 -400) | Attendance and placement logs, monthly | Learners can afford data and transport |
| Output 2 | Employers offer structured placements | Number of employers hosting placements (0 – 60) | Signed placement agreements | Employers see value in hosting |
| Activities | Run 20 cohorts; train 12 trainers; broker placements | Budget and staff time | Finance and activity reports, quarterly | Funding arrives on schedule |
What are the common logframe mistakes
- Activities written as outputs. “Training delivered” is an activity. “400 graduates complete the course” is an output.
- Outcomes you cannot influence. If the outcome is the same as the national goal, you will never be able to show your contribution.
- Too many indicators. Two or three per result is plenty. Every indicator costs money to collect.
- Indicators with the target built in. “Increase employment by 30%” mixes the measure with the target. Keep the indicator neutral and put the number in the target.
- Vague means of verification. Name the tool, the frequency and the breakdown.
- Assumptions that are really risks, or assumptions that are always true (“staff will come to work”).
- A logframe written once and never opened again. It should guide every quarterly review.
Build your logframe with the free Theory of Change Builder
The Theory of Change Builder is a free online tool that walks you through your theory of change one step at a time and turns it into a results framework (logframe) automatically. Every result gets a code (OC1, OP1, A1), indicators carry baselines, targets and means of verification, and risks are rated on a likelihood and impact grid with a mitigation measure.
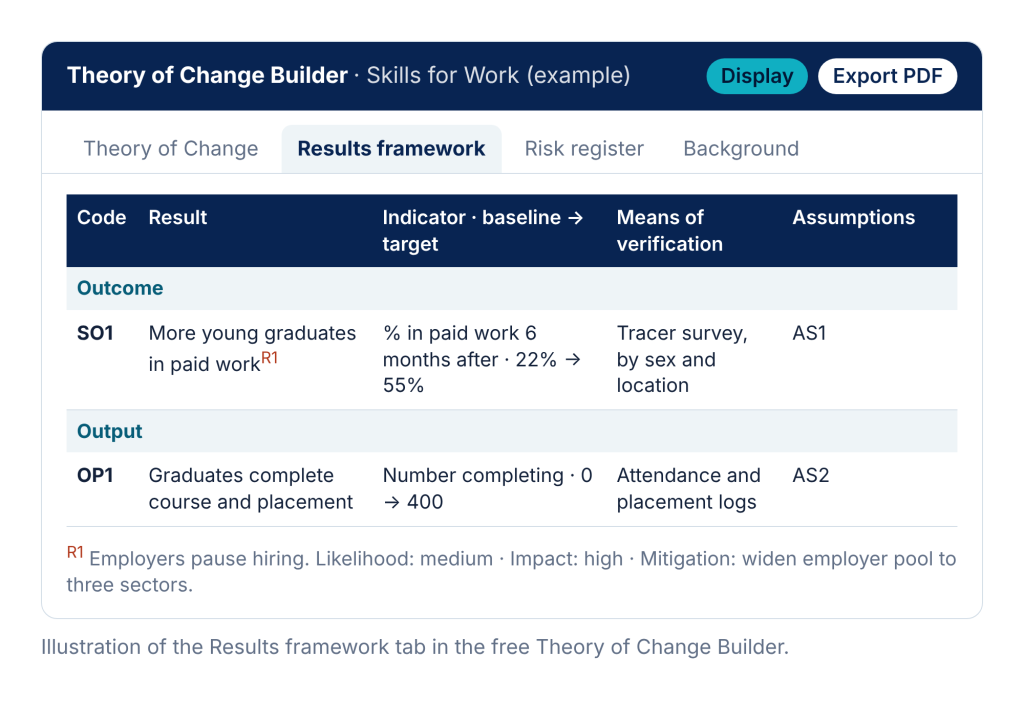
- Sixteen logic checks, including SMART checks on your objective and indicators.
- Export to PDF or an editable Word file, or send a share link to colleagues.
- Private by design: your work stays in your browser; nothing you type is sent to our site.
- Worked example included, so you can see a finished logframe before you start your own.
Once your project is running, bring the same indicators into the Impact Dashboard to track progress against target each reporting period. Our guide to monitoring and evaluation shows how the two work together.
Fequently Asked Questions (FAQs)
Is a logframe the same as a results framework?
Very close. A results framework usually shows the results chain and indicators; a logframe adds means of verification and assumptions in a fixed matrix. Many funders use the terms interchangeably, so follow your funder’s template.
How many indicators should a logframe have?
One to three per result. A two-year project rarely needs more than ten to twelve in total.
Can I change my logframe after the project starts?
Yes, and you should when evidence shows the logic needs adjusting. Agree changes with your funder and keep a record of what changed and why.
Do I need a theory of change if I already have a logframe?
It is strongly recommended. The theory of change explains why your logframe should work, and it helps you adapt when it does not.
Build your logframe in under an hour
Start from a worked example, follow the guided steps and export a funder-ready results framework.