
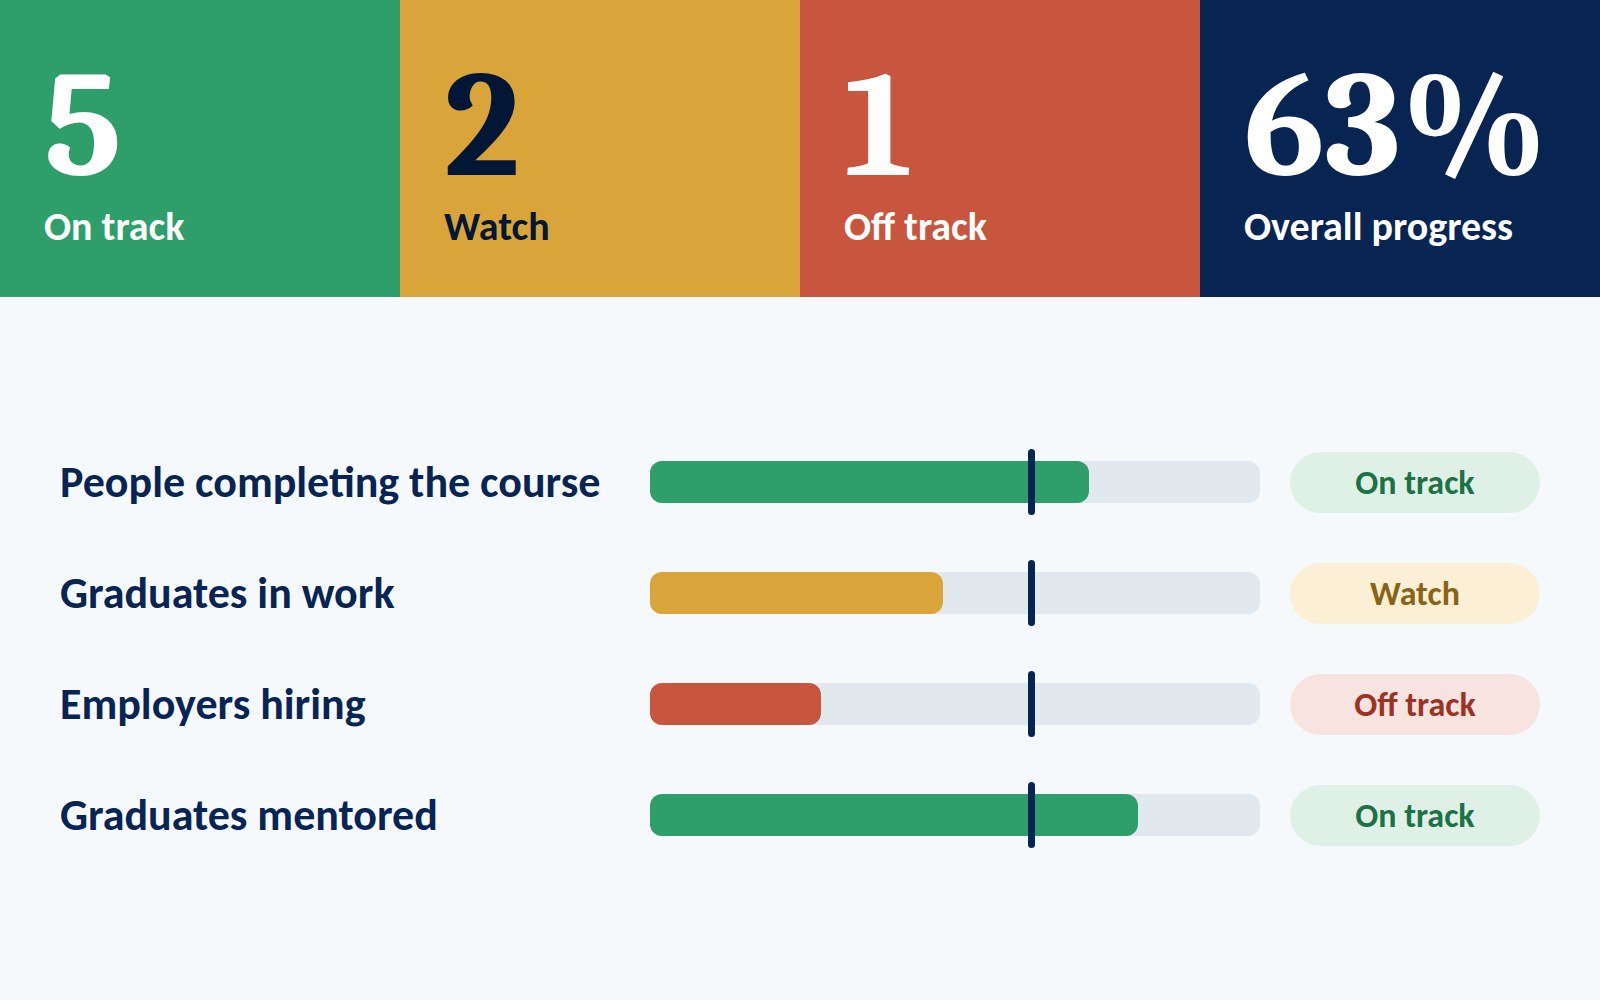
Monitoring and evaluation, often shortened to M&E, is how a project knows whether it is working. Done well, it is light enough to keep up and useful enough that people look at it. This guide sets out a practical approach: choose a few strong indicators, set baselines and targets, and track progress on a live impact dashboard your team will open.
What monitoring and evaluation means
Monitoring is the regular collection of information while the work is under way. It answers: are we doing what we planned, and is it producing what we expected? Evaluation is a periodic, deeper look. It answers: did the work make a difference, for whom, and why? The two feed a third habit, learning, which is where results turn into decisions.
Start from your theory of change
Monitoring and evaluation follows from a clear picture of the change you expect. If you have a theory of change, each outcome and output in it is something you can measure. If you do not have one yet, start there: the Theory of Change Builder will take you through it and its indicators carry straight into the dashboard.
Choose a few strong indicators
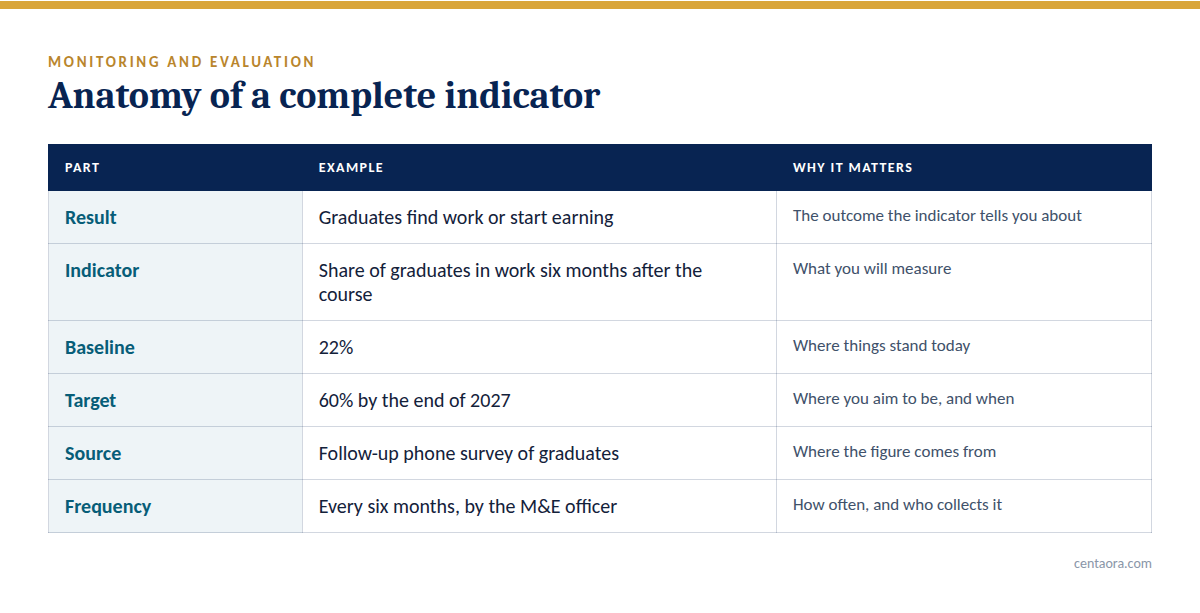
An indicator is what you will measure to know whether a result has happened. The most common mistake in monitoring and evaluation is collecting too many. Two good indicators per outcome are enough for most projects.
A strong indicator is:
- Specific. It measures one thing, and two people would count it the same way.
- Tied to a result. It tells you about an outcome or output in your theory of change, not about activity for its own sake.
- Practical to collect. You know where the figure comes from and who will gather it.
- Useful. Someone will make a decision differently depending on what it shows.
Useful patterns to start from: “number of…”, “share of…”, “level of…” and “time taken to…”.
Set baselines and targets
A baseline is the value today, before your work has had an effect. A target is the value you aim for, with a date. Without a baseline you cannot show change; without a target you cannot say whether the change is enough. If no baseline exists, plan to collect one in the first weeks and say so plainly.
Plan how the data will be collected
For each indicator, write down four things: where the information comes from, how often it is collected, who collects it, and who checks it. A one-page monitoring plan with those four columns prevents most of the gaps that appear at reporting time.
Track progress: on track, watch, off track
A figure on its own says little. “245 people trained” is good news in month three and bad news in month twenty. Progress only makes sense against time.
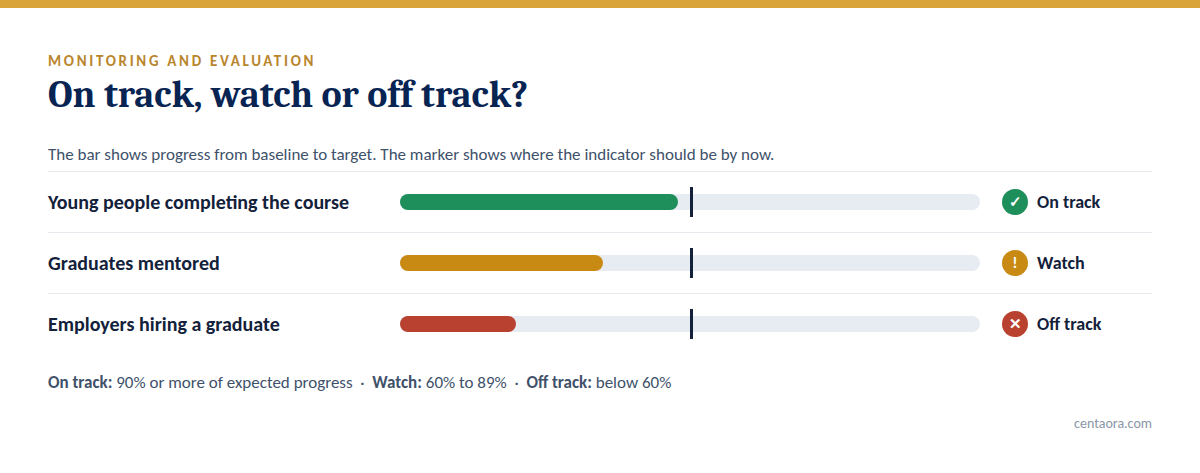
A simple rule works well. Compare how far an indicator has moved from its baseline towards its target with how much of the project’s time has passed:
- On track: 90% or more of the progress you would expect by now.
- Watch: between 60% and 89%.
- Off track: below 60%.
A red indicator is useful. It shows where to look. Teams that hide weak results stop learning; teams that discuss them improve.
Why use a live impact dashboard
Many organisations keep their indicators in a spreadsheet that one person understands, or look to business intelligence tools such as Power BI, which are powerful but take time and skill to set up. A monitoring and evaluation dashboard should be simple enough that a programme team can run it without a specialist.
The Centaora Impact Dashboard is built for that. You add your indicators, enter results each period, or paste them from Excel, and it works out progress, flags what needs attention and shows the trend for each indicator.
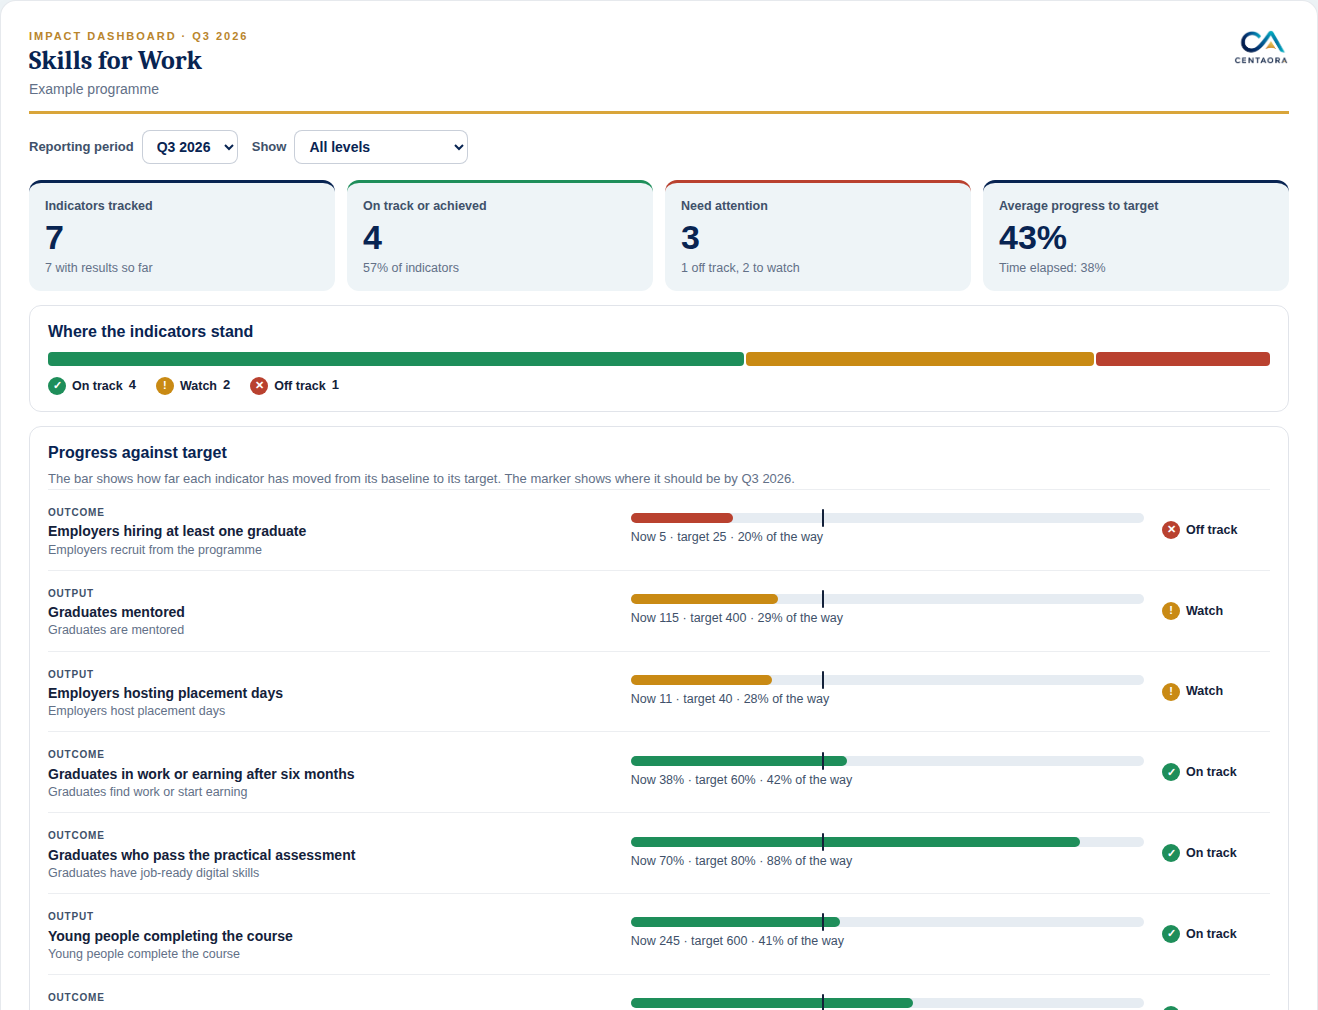
You can present it full screen in a review meeting, save it as a PDF for a report, or share a link with colleagues.
Review and learn
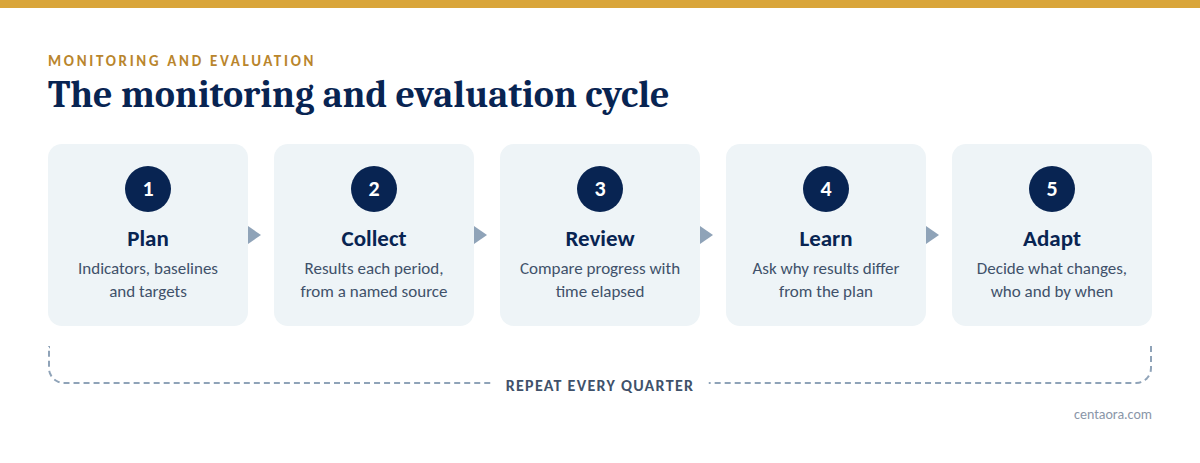
Set a rhythm: check monthly that data is coming in, review the dashboard as a team every quarter, and revisit the theory of change once a year. In every review, ask four questions:
- What did we expect to see by now?
- What do we see, in the data and from people?
- Why is there a difference?
- What will we change, who will do it, and by when?
End each review with decisions that are written down and have an owner.
Get the Monitoring, Evaluation and Impact Toolkit
The free Monitoring, Evaluation & Impact Toolkit brings this together: a ten-page guide, six editable worksheets, an Excel tracker for working offline, and the online Impact Dashboard.
Frequently asked questions
What is the difference between monitoring and evaluation?
Monitoring is continuous and tracks progress against the plan. Evaluation happens at set points and judges whether the work made a difference and why. Monitoring data is the main raw material for a good evaluation.
How many indicators should a project have?
Fewer than most teams expect. One or two per outcome, and one per output where it helps, is a workable set. If nobody would act on an indicator, drop it.
Do small organisations need monitoring and evaluation?
Yes, in a size that fits. A handful of indicators reviewed every quarter is better than an elaborate framework nobody maintains. It also makes funding applications and reports far quicker to write.