
Most indicators fail long before anyone collects data. They fail at the wording: too vague to measure, too broad to attribute, or missing the one number that would tell you whether you are on track. Here is how to write indicators that work, with examples you can adapt.
An indicator is a signal that tells you whether a result is happening. Get it right and your monitoring almost runs itself: everyone knows what to count, when, and what “good” looks like. Get it wrong and you spend three years collecting data that cannot answer the question your board, your funder or your own team is asking.
What makes an indicator SMART?
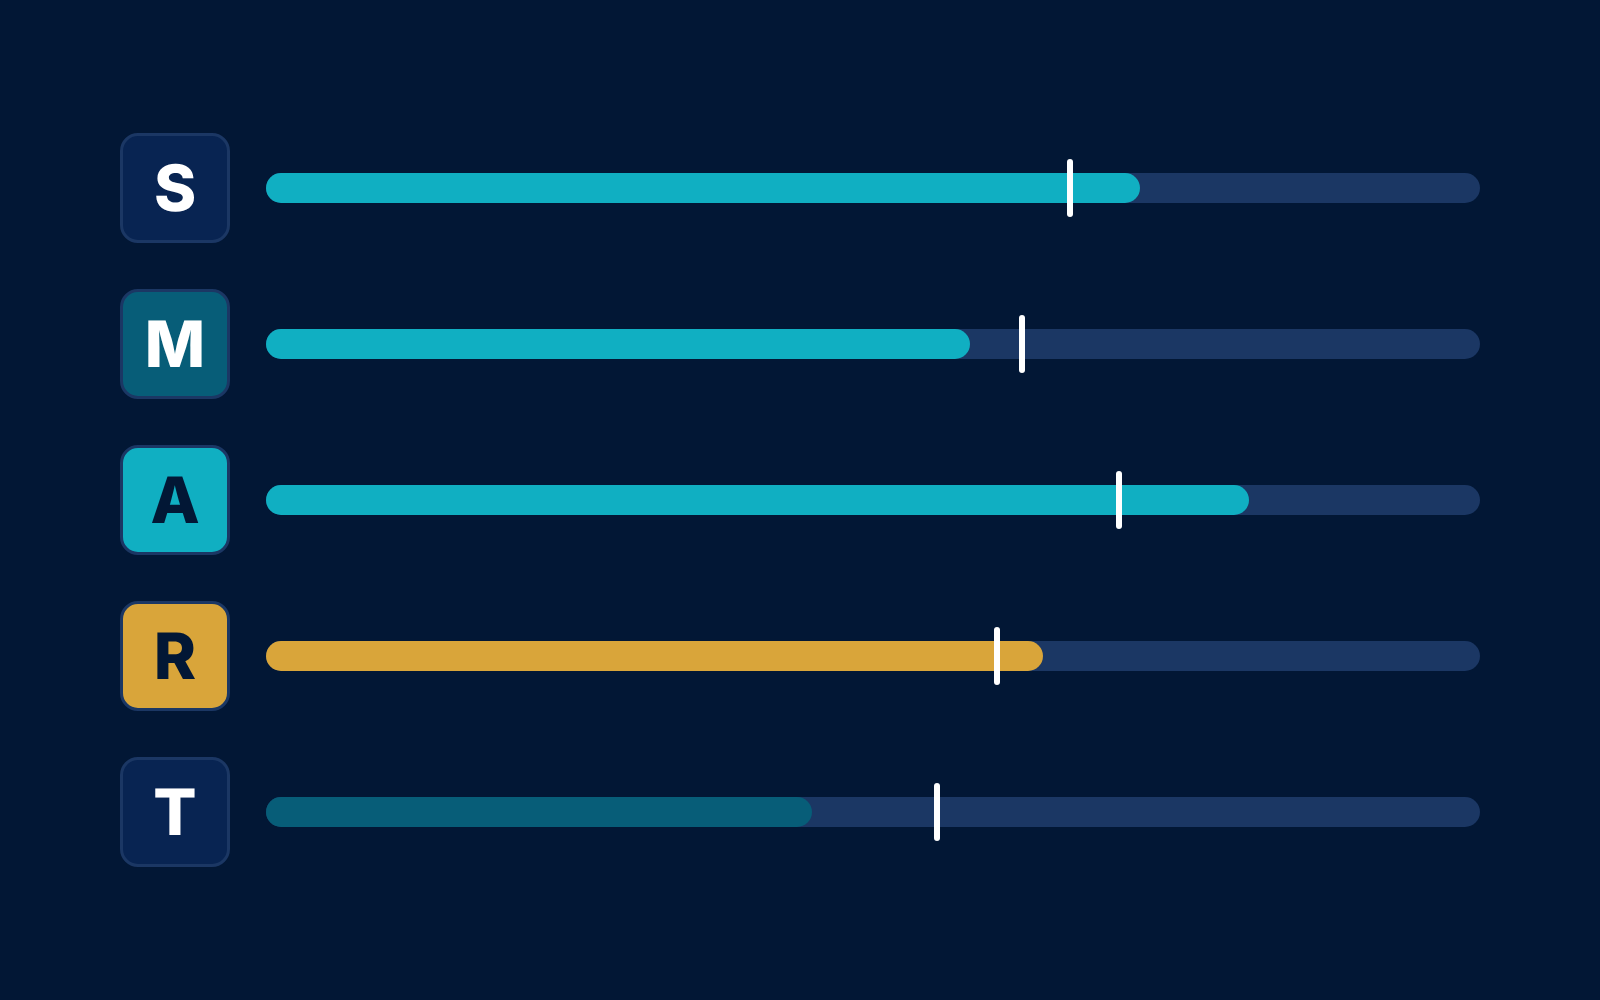
SMART is the most widely used quality test for indicators. The letters are defined in slightly different ways across organisations (Switchboard’s SMART indicators checklist lists several variants), but the common core is:
Specific
It measures one thing, for a defined group, with no room for interpretation.
Measurable
It has a unit (number, percentage, score) and a source you can actually collect.
Achievable
The target is realistic for your budget, time and context.
Relevant
It tells you something about the result it sits under, not a neighbouring one.
Time-bound
It says when the measurement is taken and by when the target should be reached.
What is a good indicator?
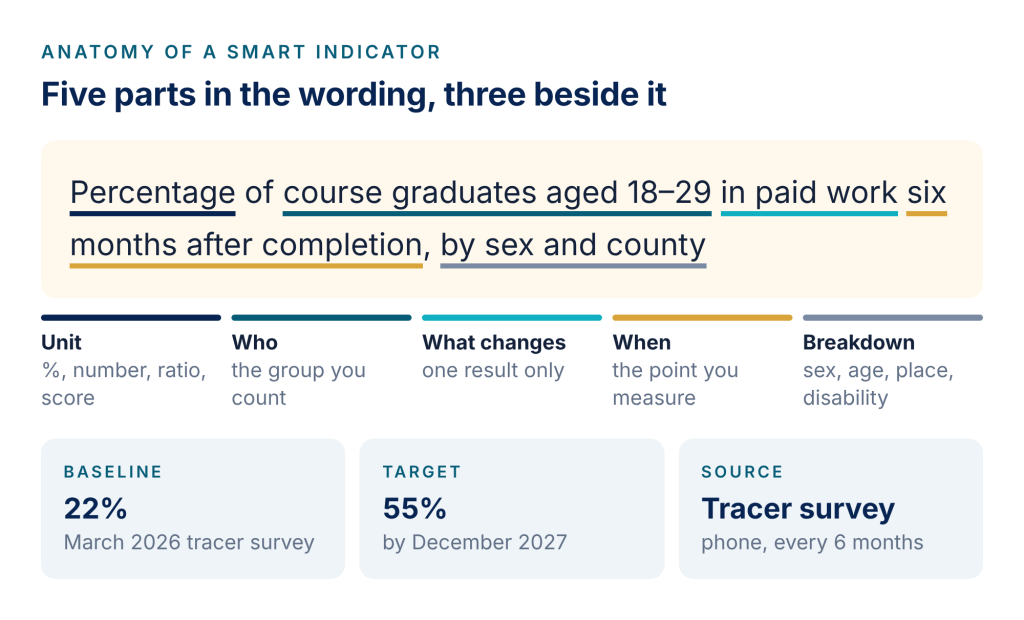
A well-written indicator has five parts in its wording and three beside it. The wording says what is counted; the baseline, target and source say how you will judge it.
Indicator or target?
“Increase employment by 30%” is a target dressed as an indicator. Keep the indicator neutral (“% of graduates in paid work six months after completion”) and put the number in the target (“55% by December 2027”). That way the same indicator can be tracked even if the target is revised.
From vague indicator to SMART
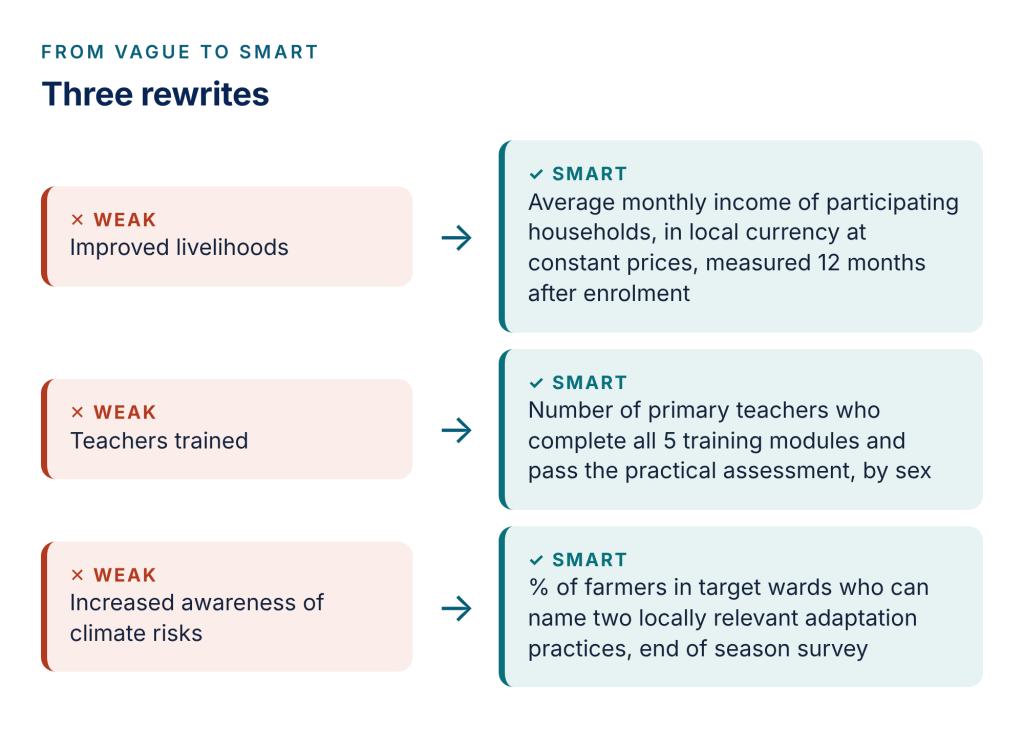
Most weak indicators are results statements with the word “improved” in them. The fix is nearly always the same: name the unit, the group, the single change, and the moment you measure.
Indicators at every level of your results chain
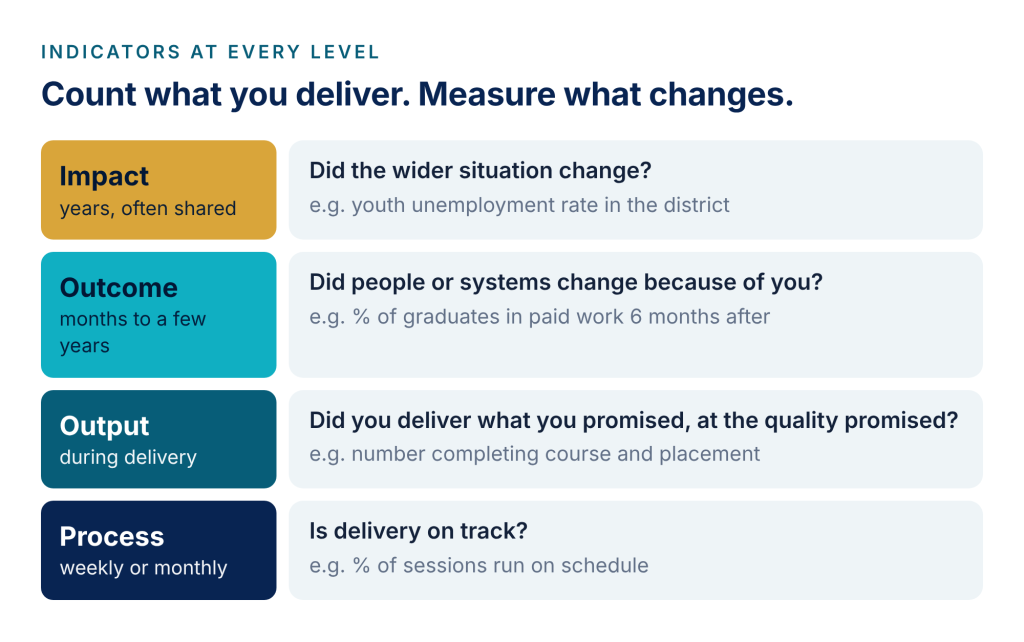
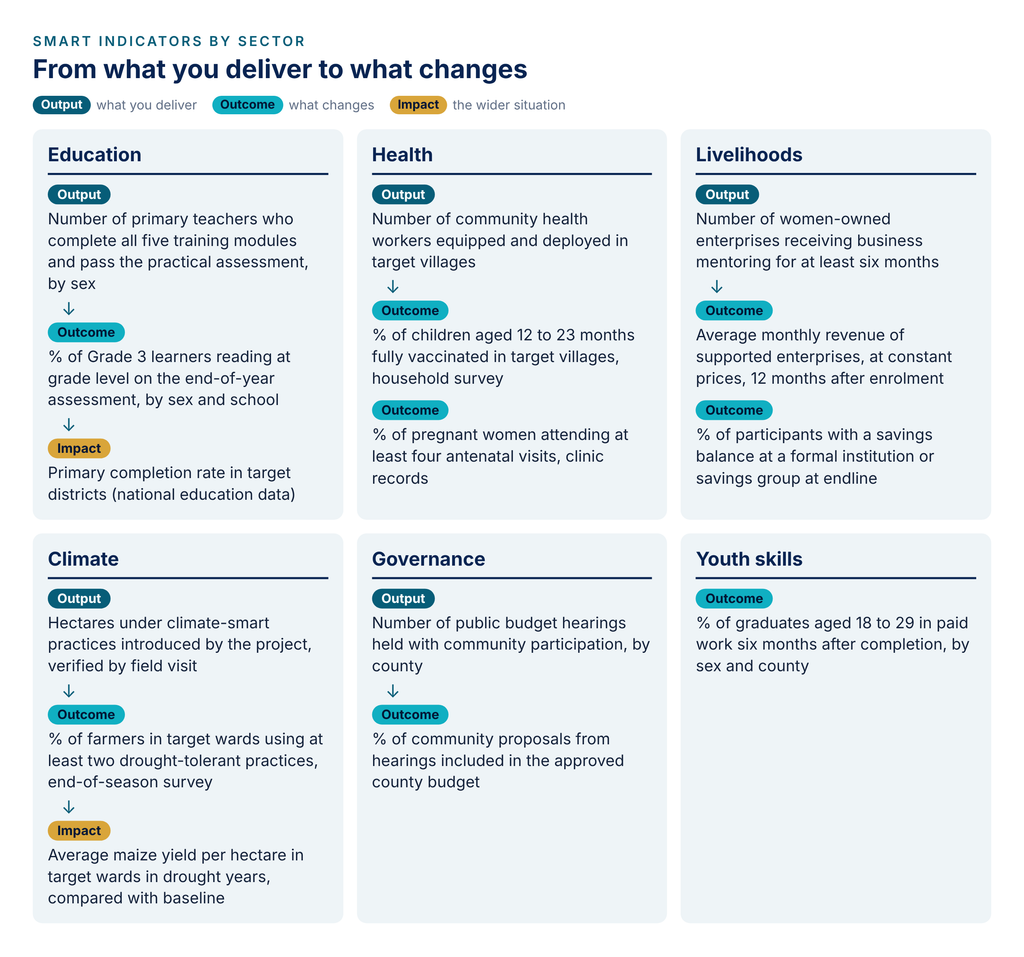
Indicators do different jobs at different levels. Output indicators confirm you delivered. Outcome indicators show whether anything changed because of it. Impact indicators track the wider situation, usually with shared data, and are rarely yours alone to move.
SMART indicators examples by sector
Use these as starting points. Replace the group, place and timeframe with your own, and check each one against your means of verification before you commit to it.
Beyond SMART: CREAM and SPICED
SMART works best for counting things. For complex or participatory programmes, two other checklists are worth knowing. CREAM (Clear, Relevant, Economic, Adequate, Monitorable) appears in the World Bank’s widely used Ten Steps to a Results-Based Monitoring and Evaluation System; its “Economic” test is a useful reminder that data has a cost. SPICED (Subjective, Participatory, Interpreted, Cross-checked, Empowering, Diverse) comes from participatory impact assessment and suits indicators defined with the people a programme serves.
As tools4dev notes, an excessive focus on SMART can crowd out the theory and reasoning behind your results. Use SMART to sharpen indicators, and your theory of change to explain what they mean.
How many indicators do you need?
Fewer than you think. One to three per result is enough for most projects, and a whole programme rarely needs more than ten to twelve. For each indicator, ask: who will collect it, how much will it cost, and what decision will it change? If nobody can answer the third question, drop it.
A ten-point indicator checklist to consider
- Does it measure one thing only?
- Does it have a unit: number, percentage, ratio or score?
- Is the group being counted clearly defined?
- Does it say when the measurement is taken?
- Is it neutral, with the ambition kept in the target?
- Is there a baseline, or a plan to collect one in the first months?
- Is the target realistic for your budget and timeframe?
- Can you name the data source, method and frequency?
- Will you break it down by sex, age, disability or location?
- Would the result change a decision if it went up or down?
Track your indicators live with the Impact Dashboard
Writing good indicators is half the job. The other half is seeing, every reporting period, which ones are on track. The free Impact Dashboard does this without Power BI or a data team: set up your indicators with baselines and targets (or bring them straight in from the Theory of Change Builder), paste in your results, and the dashboard shows progress against target with an expected-by-now marker.
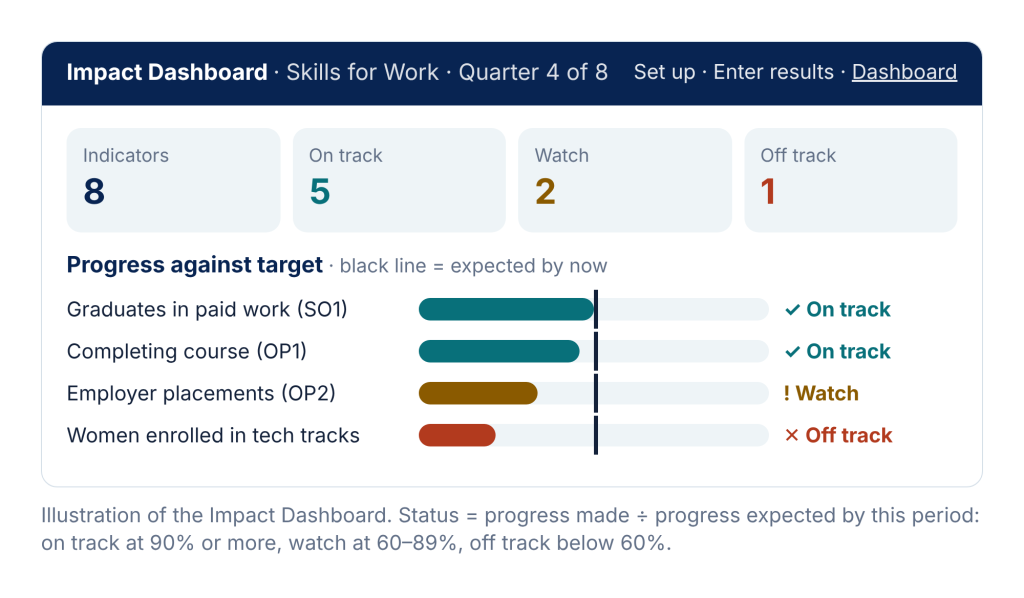
The status rule is simple and transparent. Say your baseline is 20%, your target 60%, and you are four quarters into an eight-quarter programme, so you should be halfway there. A result of 40% has covered half the distance: on track. A result of 30% has covered a quarter, only half of what was expected: off track, and worth a conversation now rather than at the final evaluation.
Frequently asked questions
What is the difference between an output and an outcome indicator?
An output indicator counts what you delivered (people trained, kits distributed). An outcome indicator measures a change in people or systems that results from it (people employed, practices adopted).
Should every indicator be disaggregated?
Disaggregate wherever the difference matters to your decisions or your funder, most often by sex, age, disability and location. Plan it at the start; it is very hard to add later.
What if I have no baseline?
Collect one in the first months of the project, or use a comparable recent data source and state it clearly. Avoid setting targets without a baseline.
Can qualitative indicators be SMART?
Yes. “% of participants who describe a specific change in their household decision-making, in end-of-year interviews” is specific, measurable and time-bound.
See your indicators on one screen
Set up your indicators, paste results from a spreadsheet and share a snapshot with your team or funder.